
Who Should Read This E-Book?
This E-Book is designed for traders that understand the basic mechanics of the markets and market terminology. This E-Book is not for individuals that have never traded.
Why Should I Buy This E-Book?
The technical trading strategies in this E-Book are the same strategies that are used everyday by the professional trader who wrote them. Serious traders and investors need every advantage possible to be successful. Join the Soaring Phoenix traders who use these strategies to put the market profit probabilities on their side.
Print, or Keep This E-Book on Your Computer.
Have this E-Book sent to you electronically, or we’ll send it to you on a CD through the mail. You can make the charts as big or small as you like with the click of your mouse. Click on the table of contents with your mouse and bring up any page you choose, or click on the thumbnail images to bring up the page.
Keep this E-Book on your Computer and use it for a reference as you look at your charts.
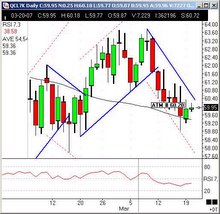
Candlestick Moving Average Use—Trendline Support and Resistance, How I Use it—Candlestick Time-Periods—What They Tell Me—Time-Period Break Points—Where to Place Protective Stops—Buy and Sell Points on a Daily Nasdaq Chart—Buy and Sell Points on a Daily Oil Chart—Buy and Sell Signals on a E-Mini S&P Daily Chart—Buy and Sell Signals on a July Daily Soybean Chart—Rimm Daily Chart with Buy and Sell Signals—QQQQ Daily Chart With Buy and Sell Signals
Intermediate-Term Trading Strategies
SP7U Weekly Chart with Buy Signal—MMM Weekly Chart with Buy Signals—BA Weekly Chart with Buy Signals—BA Weekly Chart with Buy Signals—GM Weekly Chart with Buy Signals—AIG Weekly Chart with Buy Signals
Long-Term Trading
AIG Monthly Chart with Buy and Sell Signals—RIMM Monthly Chart with Buy and Sell Signals—SP7U Monthly Chart with Buy Signals—SP7U Monthly Chart with Moving Averages, Trendlines, and the RSI


No comments:
Post a Comment